A market can look enormous on paper and still be difficult to enter. The difference often becomes visible when you separate the total opportunity from the customers you can serve and the revenue you can realistically capture. A clear our Business Model Canvas guide can help you connect those market assumptions to your wider business model.
If you are searching for TAM SAM SOM examples, the central lesson is simple: TAM expresses the ceiling, SAM defines the reachable market, and SOM establishes a credible near-term target. The model is useful for startups, established companies, investors, consultants, and business leaders who need to turn market research into focused strategic choices.
What do TAM, SAM, and SOM actually measure?
TAM, SAM, and SOM are three layers of market sizing. They are related, but they answer different business questions.
- TAM, or Total Addressable Market, is the full revenue opportunity for a product or service if the business captured all relevant demand.
- SAM, or Serviceable Addressable Market, is the part of TAM that fits the company’s product, geography, customer profile, distribution model, and operating capabilities.
- SOM, or Serviceable Obtainable Market, is the portion of SAM that the business can realistically capture within a defined period.
TAM is therefore a strategic ceiling, not a sales forecast. It may help communicate long-term potential, but it usually assumes that every qualified customer chooses your offer. That assumption makes TAM useful for framing opportunity, but insufficient for setting operating targets.
SAM introduces practical boundaries. It asks whether your product is relevant to a specific segment and whether your business can reach that segment. Geography, industry, company size, product features, pricing, regulations, and distribution channels can all reduce SAM.
SOM adds execution reality. It considers sales capacity, marketing reach, competitive intensity, customer acquisition, brand awareness, available funding, and the time required to convert demand. A 2026 market sizing guide illustrates the same structure through regional restaurant and B2B software examples, with each layer tied to a named data source.
What is a practical TAM SAM SOM example?
Consider a fictional company selling presentation software for consultants and strategy teams. The product helps users create structured, board-ready presentations with reusable frameworks and collaborative editing.
Assume the company begins with the following inputs:
- There are 2,000,000 potential professional users across the global market.
- The expected annual revenue per user is $240.
- The initial product supports English-language teams and selected professional services segments.
- The first-year commercial team can acquire approximately 1,500 paying customers.
TAM calculation
The TAM formula is:
TAM = Total potential customers × Annual revenue per customer
In this example:
2,000,000 users × $240 = $480 million TAM
This figure describes the theoretical annual revenue opportunity if every potential user purchased the product. It does not mean the company can reach every user, serve every use case, or win the entire category.
SAM calculation
Now narrow the market to professional services firms and internal strategy teams that match the product’s features, language, and distribution model. Suppose this segment represents 300,000 potential users.
300,000 users × $240 = $72 million SAM
The SAM is more useful for planning because it reflects the market the company can currently address. It still assumes that the company could eventually serve every suitable customer within that segment.
SOM calculation
Finally, consider the company’s actual commercial capacity. If the team can acquire 1,500 customers during the first year, the obtainable revenue is:
1,500 customers × $240 = $360,000 SOM
The result is much smaller than the TAM. That is not a weakness. It shows that the company has separated long-term opportunity from short-term execution.
A credible model should explain the path from $360,000 to a larger share of the $72 million SAM. That path might include a larger sales team, stronger partnerships, additional languages, improved product integration, higher retention, or expansion into adjacent customer segments.
How do you calculate TAM, SAM, and SOM correctly?
The most useful market sizing model begins with a precise market definition. You should specify the product category, customer type, geography, revenue model, purchasing frequency, and time period before collecting numbers.
Step 1: Define the customer and use case
A vague market produces an inflated result. “Businesses that need presentations” is too broad for a reliable estimate. “Strategy consultants in English-speaking markets who create more than ten client presentations annually” is more specific.
Define the customer by needs and buying behavior, not only by demographics. In B2B markets, consider industry, employee count, annual revenue, job role, budget ownership, buying process, and existing tools.
Step 2: Estimate the number of potential customers
Use company databases, official statistics, industry associations, customer interviews, public filings, surveys, and internal sales data. Record the source and date for every important assumption.
When a figure is unavailable, use a range rather than false precision. For example, you might estimate between 250,000 and 350,000 qualified businesses. You can then show how the SOM changes under conservative, central, and optimistic scenarios.
Step 3: Establish annual revenue per customer
Annual revenue per customer can come from existing contracts, published pricing, comparable products, customer interviews, or a value-based pricing hypothesis. Keep the calculation consistent with your business model.
A subscription company should use annual recurring revenue per account. A transaction business may use annual purchase frequency multiplied by average order value. A consulting business may use annual project value multiplied by expected project frequency.
Step 4: Filter TAM into SAM
Apply clear filters to identify customers your business can serve. Common filters include:
- Geographic availability
- Product and feature fit
- Industry or company size
- Language and regulatory requirements
- Distribution and delivery capacity
- Price compatibility
Do not treat every possible customer as serviceable. A customer belongs in SAM only when your current offer can solve a relevant problem and your business can reach that customer through realistic channels.
Step 5: Estimate SOM from execution capacity
SOM should connect directly to a sales or growth model. Start with the number of qualified prospects you can reach, apply an expected conversion rate, and multiply the resulting customers by annual revenue per customer.
For example:
10,000 qualified prospects × 15% sales opportunity rate × 10% close rate = 150 customers
150 customers × $240 annual revenue = $36,000 SOM
This model is more defensible than simply claiming that the business will capture 1% of a large market. It ties the estimate to identifiable activities, conversion assumptions, and commercial resources.

Which market sizing method should you use?
There are three common approaches: top-down, bottom-up, and value theory. Each approach has a different purpose, and the strongest analyses often use more than one.
Top-down market sizing
The top-down method starts with a broad industry figure and narrows it using percentages or segmentation assumptions. For example, you might begin with total spending in a software category, then filter for geography, company size, and product relevance.
This approach is useful when you are entering a new market and lack customer data. It is fast and can provide a high-level view. Its weakness is that broad industry categories may include products, customers, or revenue streams that your business cannot actually address.
Bottom-up market sizing
The bottom-up method starts with identifiable customers, realistic prices, and expected purchasing behavior. You might count the number of qualified companies, estimate annual revenue per account, and calculate the revenue opportunity from that defined group.
Bottom-up analysis usually requires more work, but it makes assumptions easier to examine. It also connects naturally to sales capacity and customer acquisition. For that reason, it is often more useful when you are preparing an operating plan or defending your assumptions in investor discussions.
To organize the customer segments, assumptions, and strategic choices behind your model, our Startup Business Canvas guide can help you structure the broader business case around the market opportunity.
Value theory sizing
Value theory is helpful when the product creates a new category or replaces several existing solutions. Instead of relying only on current category revenue, estimate the economic value your offer creates and the share of that value customers might pay to access.
This method is more subjective. You should support it with customer interviews, willingness-to-pay research, pilot results, and comparisons with the costs of existing alternatives.
A practical rule is to use top-down analysis for context, bottom-up analysis for credibility, and value theory for innovation. A 2026 market sizing analysis similarly recommends pairing a broad TAM with a bottom-up explanation of the SOM and its connection to pipeline or customer acquisition.
How should you present TAM SAM SOM in a pitch deck?
A market sizing slide should make the logic visible within a few seconds. The audience should understand the market definition, the source of the numbers, the assumptions behind the filters, and the reason the SOM is achievable.
A simple structure works well:
- TAM: State the broad revenue opportunity and define its boundaries.
- SAM: Show the customer segment your product can serve today.
- SOM: Explain the near-term revenue target and the commercial resources behind it.
- Evidence: Add the source, calculation method, and date for the key assumptions.
Use one visual hierarchy rather than several disconnected charts. Nested circles, a narrowing funnel, or three clearly labeled blocks can work. The visual should support the argument, not replace it.
Each figure should answer a different question. TAM answers whether the opportunity is large enough to matter. SAM answers where the company should focus. SOM answers whether the near-term target matches the current go-to-market plan.
Do not hide the assumptions in tiny footnotes. If your SAM depends on a narrow industry segment, state that segment directly. If your SOM depends on a specific number of sales representatives, show the relationship.
For presentation quality, our Business model prototyping guide can help you test how the market story works as part of a broader strategic narrative rather than as an isolated slide.
What mistakes weaken TAM SAM SOM examples?
Most weak examples do not fail because the formulas are difficult. They fail because the definitions, assumptions, and operating plan do not match.
Using an unrelated industry figure
A large category figure may include customers who do not need your product. It may also include different price points, business models, or geographic markets. A smaller market with a clear connection to your customer is more useful than a larger but irrelevant category.
Confusing TAM with demand
TAM is not the amount of revenue you will earn. It is the maximum opportunity under broad assumptions. You should not use it as a forecast, budget, hiring plan, or first-year sales target.
Calculating SOM as an arbitrary percentage
A statement such as “we will capture 1% of the market” is incomplete without a reason. Explain how many prospects you can reach, how many sales conversations you can conduct, what conversion rate you expect, and how much each customer contributes.
Mixing customer counts and revenue
Keep the unit consistent. If TAM is calculated as annual revenue, SAM and SOM should also be expressed as annual revenue. If you show customer counts, label them separately and explain the price assumption.
Ignoring competition and capacity
A business may have strong product demand but insufficient delivery, support, sales, or production capacity. Competitive alternatives also affect conversion rates and customer acquisition costs. SOM must reflect these constraints.
Failing to date the assumptions
Market conditions change. Every external figure should include its publication year, while internal assumptions should include the period they describe. This is especially important when your model supports a 2026 strategy, forecast, or fundraising plan.
How can you turn the model into strategic decisions?
Once the calculations are complete, connect each layer to a decision. TAM can influence category selection, long-term positioning, and investor communication. SAM can guide segmentation, product priorities, geographic focus, and channel planning. SOM can shape hiring, budgets, sales targets, and quarterly milestones.
If the TAM is attractive but the SAM is small, the product may need broader functionality or a different distribution model. If the SAM is large but the SOM is weak, the primary constraint may be sales capacity, competition, pricing, or customer trust.
You can also use the model to compare strategic options. For example, entering a second geography may increase SAM, but it may also add regulatory, localization, and support costs. Serving a larger company segment may increase revenue per customer, but it may lengthen the buying cycle.
Review the model when you launch a new product, enter a new market, change pricing, expand the sales team, or prepare a funding round. Treat it as a working decision tool rather than a static slide.
How do you know whether your estimate is credible?
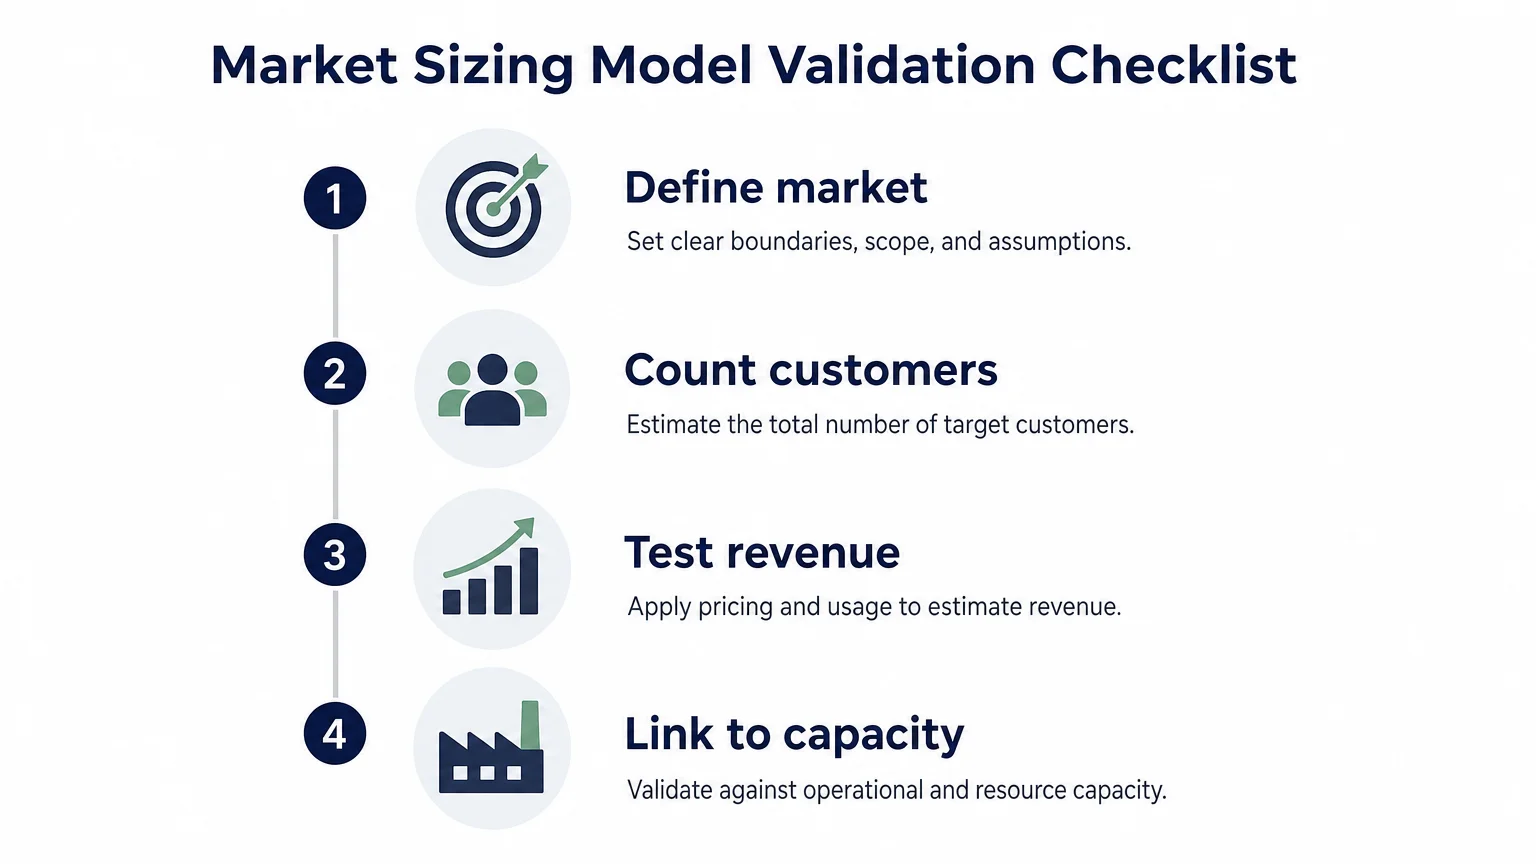
A credible estimate is transparent, internally consistent, and connected to evidence. Someone reviewing the model should be able to understand what market you defined, where the customer count came from, how revenue per customer was estimated, and why the SOM fits your resources.
Use a short assumptions register alongside the model. Include the source, date, calculation, confidence level, and owner for each major input. Mark uncertain assumptions clearly, then identify the research or experiment that will improve them.
Validation can include customer interviews, pricing tests, landing page experiments, pilot sales, competitor analysis, win and loss reviews, and analysis of your existing pipeline. Each activity should reduce a specific uncertainty.
The goal is not to produce a perfect number. The goal is to produce a useful range that supports better choices. A disciplined estimate can show that you should narrow the audience, adjust the offer, change the price, or delay expansion until the current segment is stronger.
Use TAM, SAM, and SOM as a decision framework
TAM SAM SOM examples are most valuable when they show disciplined progression from possibility to focus and execution. Define the market carefully, use bottom-up evidence where possible, separate revenue opportunity from attainable sales, and connect the SOM to real customer acquisition capacity. A clear model will not remove uncertainty, but it will make your strategic assumptions easier to test and improve.
Take action with Deckadence
Market sizing becomes more persuasive when the analysis is connected to a clear business model, a focused customer segment, and a coherent strategic narrative. If your TAM, SAM, and SOM calculations need to support an executive discussion, investor presentation, or internal decision, structured visual thinking can help your audience understand the logic quickly.

We bring strategic structure and refined presentation design together through frameworks, narrative structures, action titles, concise messaging, and board-ready slide systems. Explore our business strategy services when you need to turn complex strategic thinking into a clearer, more persuasive story.
Frequently Asked Questions
What is the difference between TAM, SAM, and SOM?
TAM is the broadest potential market, SAM is the portion your business can serve, and SOM is the share you can realistically capture. The three metrics move from long-term opportunity to near-term execution.
Which formula is used to calculate TAM?
The common formula is the total number of potential customers multiplied by annual revenue per customer. You should define the customer group and revenue period clearly before applying the formula.
Can a startup calculate SOM before launching?
Yes, but the result is a forecast rather than an observed market share. Use comparable businesses, planned sales capacity, pilot evidence, and conservative conversion assumptions to create a credible range.
Should TAM, SAM, and SOM appear on one slide?
They can appear on one slide when the market definition and calculations are simple. If the assumptions require more explanation, use a main market opportunity slide followed by a methodology or go-to-market slide.
How can Deckadence help with market sizing communication?
We help turn strategic analysis into structured, presentation-ready stories through frameworks, narrative structures, and slide systems. Our Business Model Canvas guide can also help you connect market sizing assumptions to customers, channels, value propositions, and revenue logic.